
Case Studies
Where the work speaks.
Each engagement is different. These are selected examples of how we approach the problems that define operations in this region.
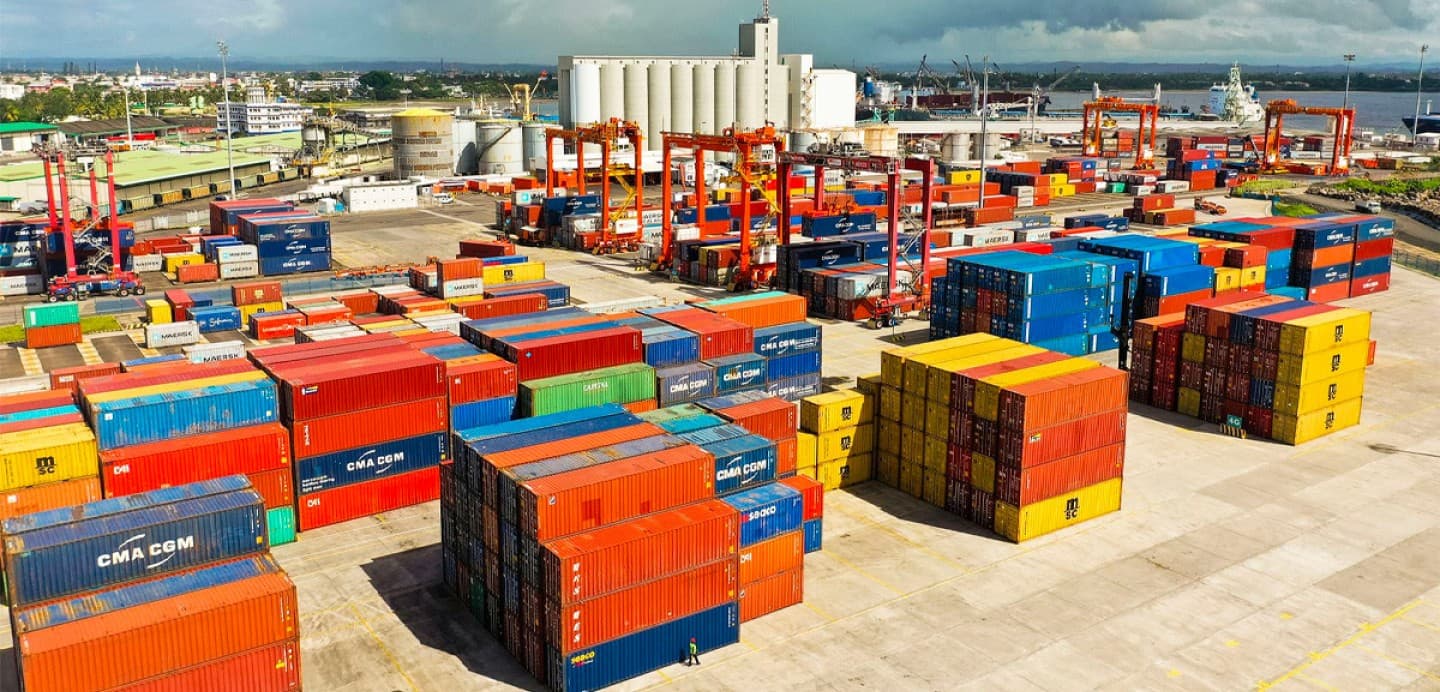
Zone portuaire · Madagascar
Rebuilding a garment export chain for margin, not just movement.
The challenge
A garment manufacturer operating out of Madagascar's Export Processing Zone was moving volume — but margin was eroding. Freight costs had crept up over two contracting cycles. Customs clearance times were inconsistent, creating buffer stock that tied up working capital. Currency exposure on a USD-billed chain with MGA-denominated production costs was unmanaged.
The approach
We mapped the full chain from fabric sourcing in Asia through production in Antananarivo, consolidation at Toamasina, ocean freight to European buyers, and final delivery. The audit covered carrier contracts, customs documentation practices, warehousing dwell time, and the payment structure on both the buy and sell sides.
Outcomes
01
Carrier contract renegotiation reduced ocean freight costs by 18% through volume consolidation with a secondary carrier on the Europe lane.
02
Customs pre-clearance process redesign cut average port dwell time from 6.2 to 3.1 days — releasing capital locked in buffer stock.
03
LC structure revised to align payment triggers with production milestones, improving cash cycle by 22 days.
04
Seasonal routing plan introduced to account for cyclone-period disruption on the RN2 corridor, eliminating two peak-season stockout events.
All figures are representative of outcomes achievable through this methodology. Client details withheld by agreement.
Engineering a 10% quarterly cost reduction through real-time visibility and corridor discipline.
The challenge
A mid-sized manufacturer in Lusaka producing woven polypropylene sacks for the regional agro sector — grain merchants, flour millers, fertiliser distributors across Southern and East Africa. Raw material (PP yarn and woven fabric) was sourced from Gujarat, India, shipped via Nhava Sheva to Beira, then overland to the factory. Despite consistent order volumes, landed cost per tonne was unpredictable quarter to quarter. The procurement team over-ordered to hedge against transit delays, tying up working capital in 90 days of safety stock. Currency exposure across USD freight, INR supplier invoices, and ZMW operating costs was unmanaged — creating P&L noise that masked the true cost of the chain.
The approach
We began with a full landed cost deconstruction from FOB Nhava Sheva to factory gate Lusaka, line by line, across six shipments. Four cost pools were leaking: ocean freight priced spot against a volume that justified a service contract; port dwell at Beira averaging 9.4 days due to documentation gaps arriving post-vessel; inland road rates with no carrier discipline; and inventory financing cost from 90-day safety stock held against a 52-day average transit. We then designed and deployed a two-module in-house SaaS: a landed cost calculator pulling live carrier rate feeds and currency quotes to produce real-time cost-per-tonne on any routing scenario, and an inventory visibility module tracking in-transit volume against factory consumption rate — automatically triggering reorders with 45 days of lead time built in.
Outcomes
01
Ocean freight cost reduced by 14% through a fixed-volume monthly service contract with a single carrier on the Nhava Sheva → Beira lane, replacing spot booking across three carriers.
02
Port dwell at Beira cut from 9.4 to 3.8 days by implementing a pre-arrival documentation protocol — Bill of Lading, phytosanitary certificate, and import declaration lodged 5 days before vessel arrival.
03
Safety stock reduced from 90 to 38 days of cover, releasing ZMW 1.2M in working capital per cycle — with zero stockout events across the two trimesters following implementation.
04
Landed cost calculator surfaced a routing opportunity via the Nacala corridor for northern Zambia deliveries, producing a 6% cost differential on those lanes — now standard for all Copperbelt orders.
All figures are representative of outcomes achievable through this methodology. Client details withheld by agreement.
More case studies coming.
We're selective about the work we take on. Each engagement we accept, we go deep. More case studies will be added as engagements close.